if (!require("ggplot2")) install.packages("ggplot2")

library(p3themes)
Visualization
Bar plot (fill aesthetic parameter)
Plot it without the P3 theme
df <- p3themes::df

bar <- ggplot(df, aes(experience2, fill = experience2)) +
    geom_bar() +
    theme_bw() +
    theme(legend.position = "none")

bar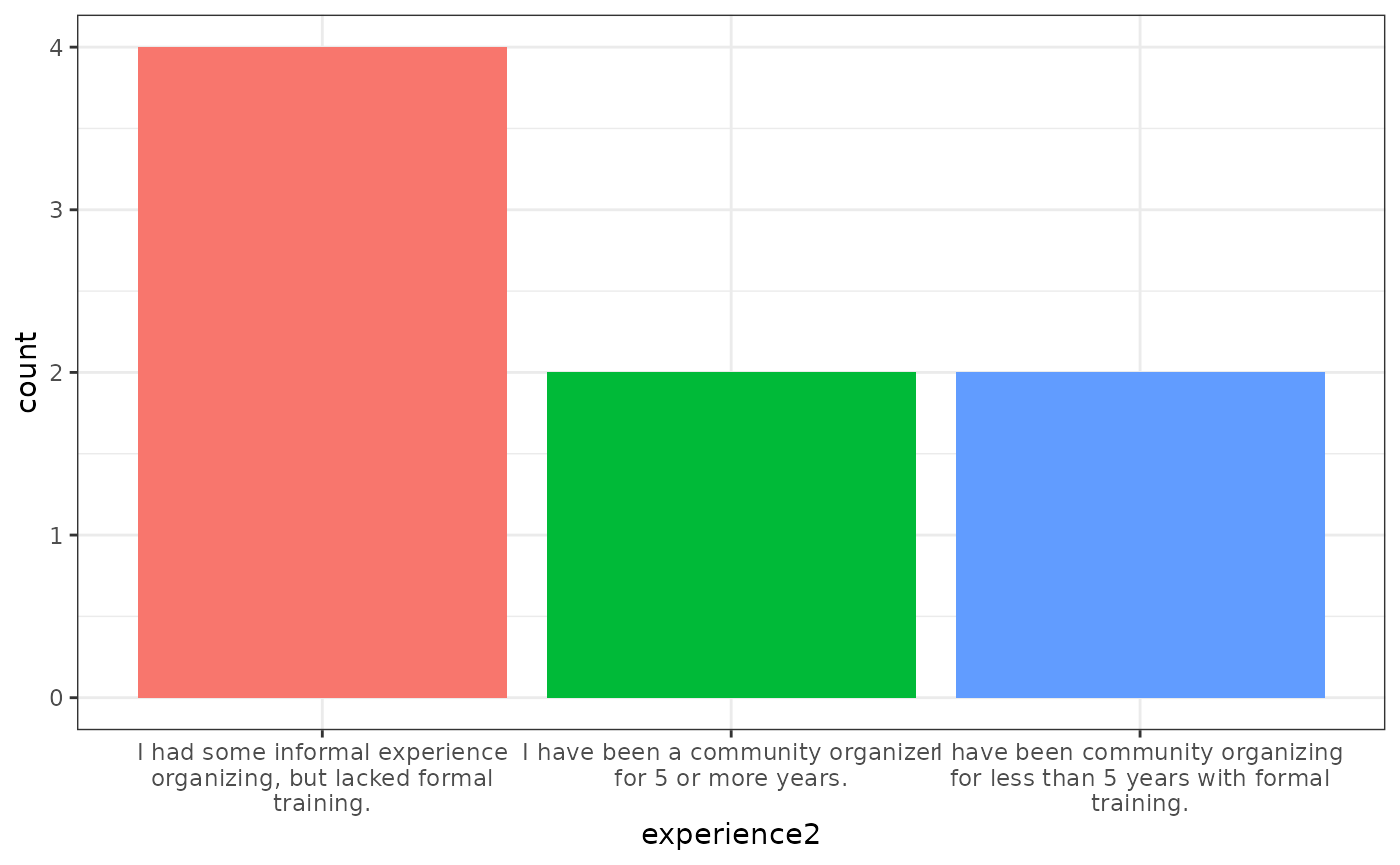
Change labels and add title/subtitle information
bar1 <- bar +
  labs(x = "Count of responses",
       y = "Organizing experience",
       title = "What was your experience with community organizing prior to joining\nthe Census effort with Houston in Action?",
       subtitle = "Organizer responses, n=8",
       caption = "Data source: Houston in Action 2020 Post-Program Survey")

bar1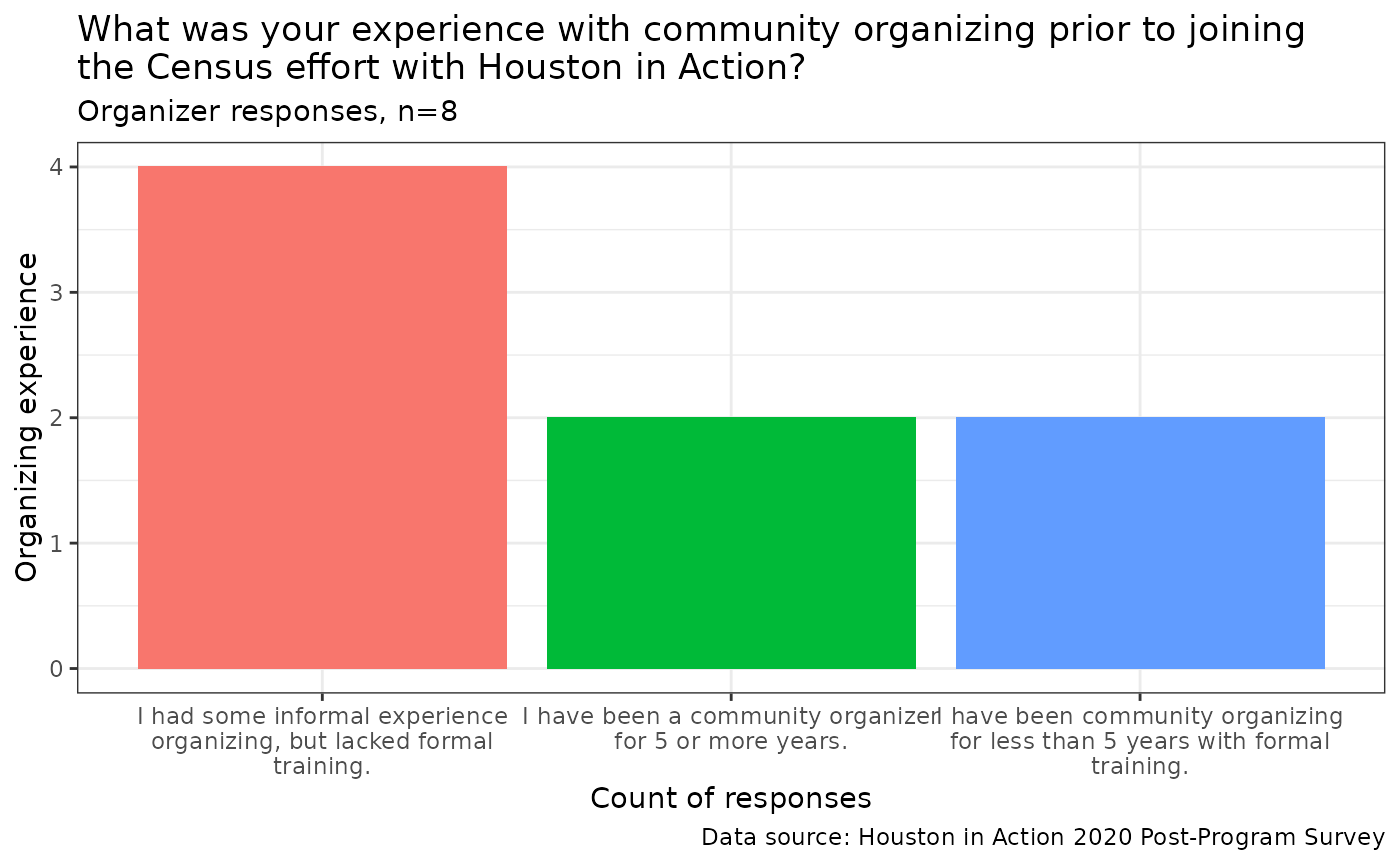
Now add the p3theme to the plot
bar2 <- add_p3theme(bar1, target = "fill") # you can skip filling in target = "fill", because "fill" is the default value for the target argument.

bar2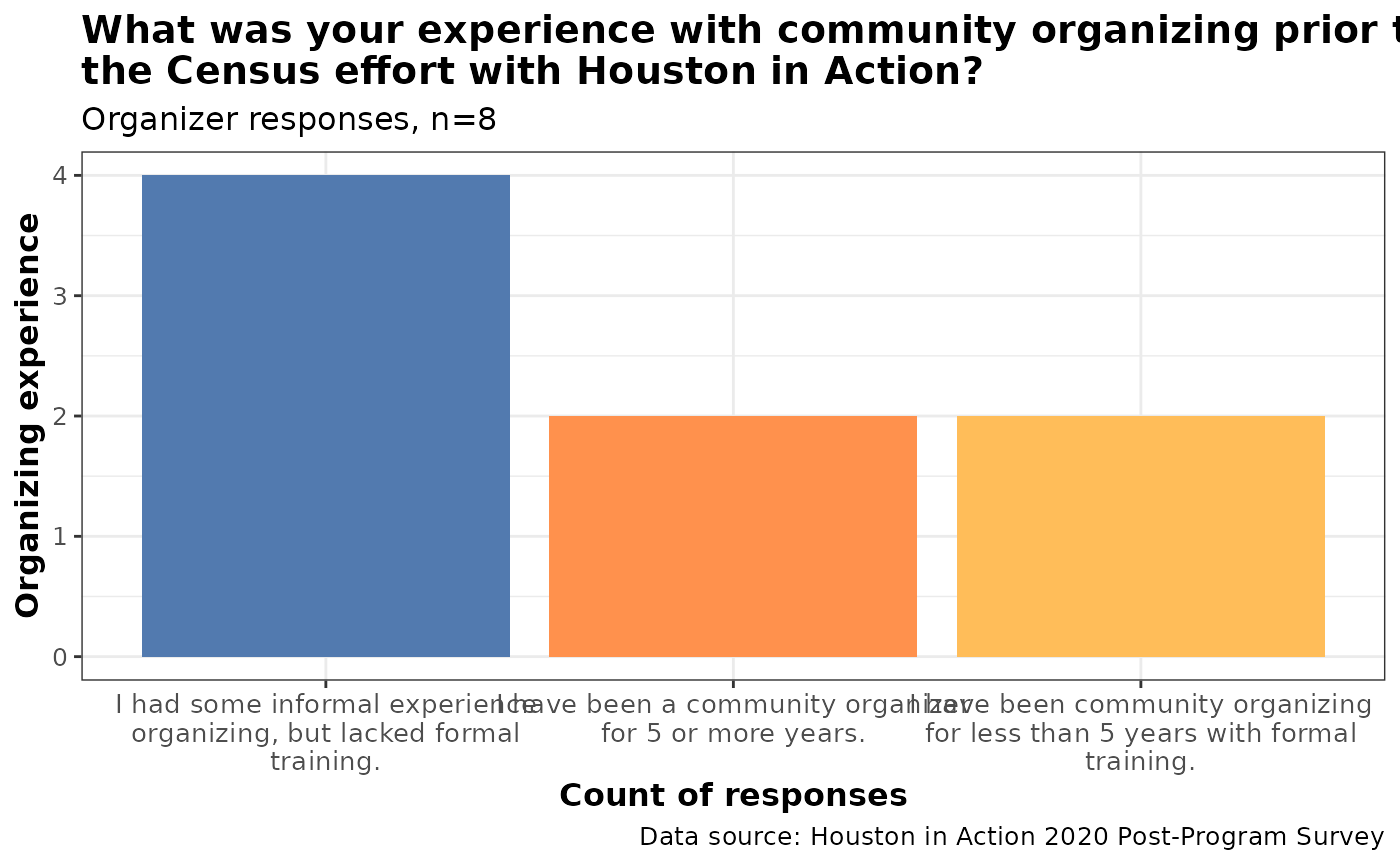
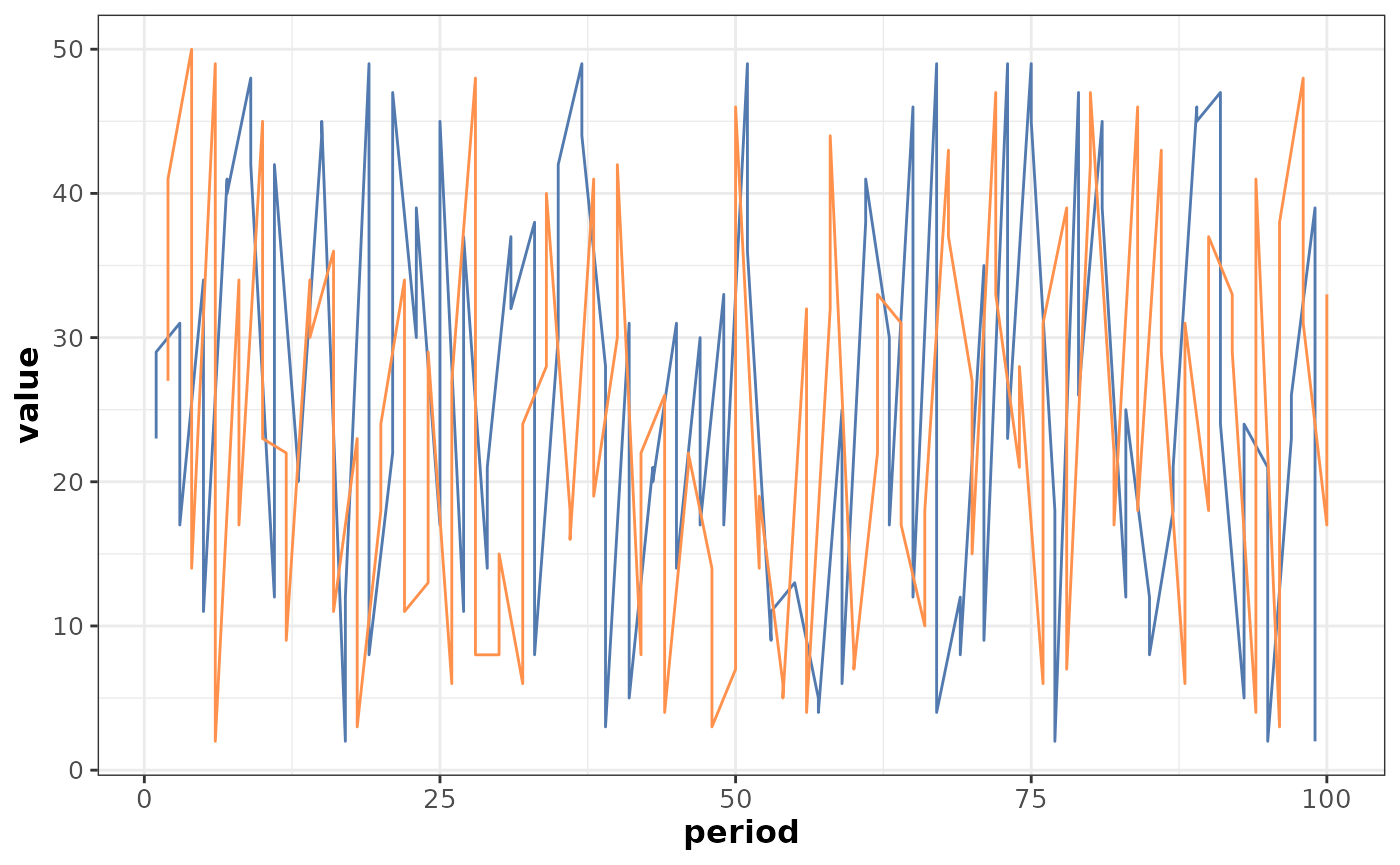
Line plot (color aesthetic parameter)
Plot it without the P3 theme
# Toy data
df <- data.frame(period = rep(c(1:100), 2),
                 value = sample(c(1:50), 200, replace = TRUE),
                 group = rep(c("A", "B"), 100))

line <- ggplot(df, aes(x = period, y = value, color = group)) +
    geom_line() +
    theme_bw() +
    theme(legend.position = "none")
Now add the p3theme to the plot
line_p3 <- add_p3theme(line, target = "color")

line_p3